Total and Bushfire-specific PM2.5 V1.3 data (Last edited on 2026-05-08)
1 Overview
The Total and Bushfire-specific PM2.5 V1.3 datasets are a set of daily time-series rasters of estimated total PM2.5 concentration covering Australia (Fig. 1.1). These additionally include a seasonal-trend decomposition using LOESS (STL) of the total PM2.5 into seasonal, trend and remainder components (Figure 1.2), as well as a series of binary flags. Both the decomposed PM2.5 components and flags may be used in identification and quantification of bushfire-related PM2.5 exposures. The original dataset accompanies the following publication:
Borchers-Arriagada, N., Morgan, G.G., Buskirk, J.V., Gopi, K., Yuen, C., Johnston, F.H., Guo, Y., Cope, M. and Hanigan, I.C. (2024) ‘Daily PM2.5 and Seasonal-Trend Decomposition to Identify Extreme Air Pollution Events from 2001 to 2020 for Continental Australia Using a Random Forest Model’, Atmosphere, 15(1341). Available at: https://doi.org/10.3390/atmos15111341.
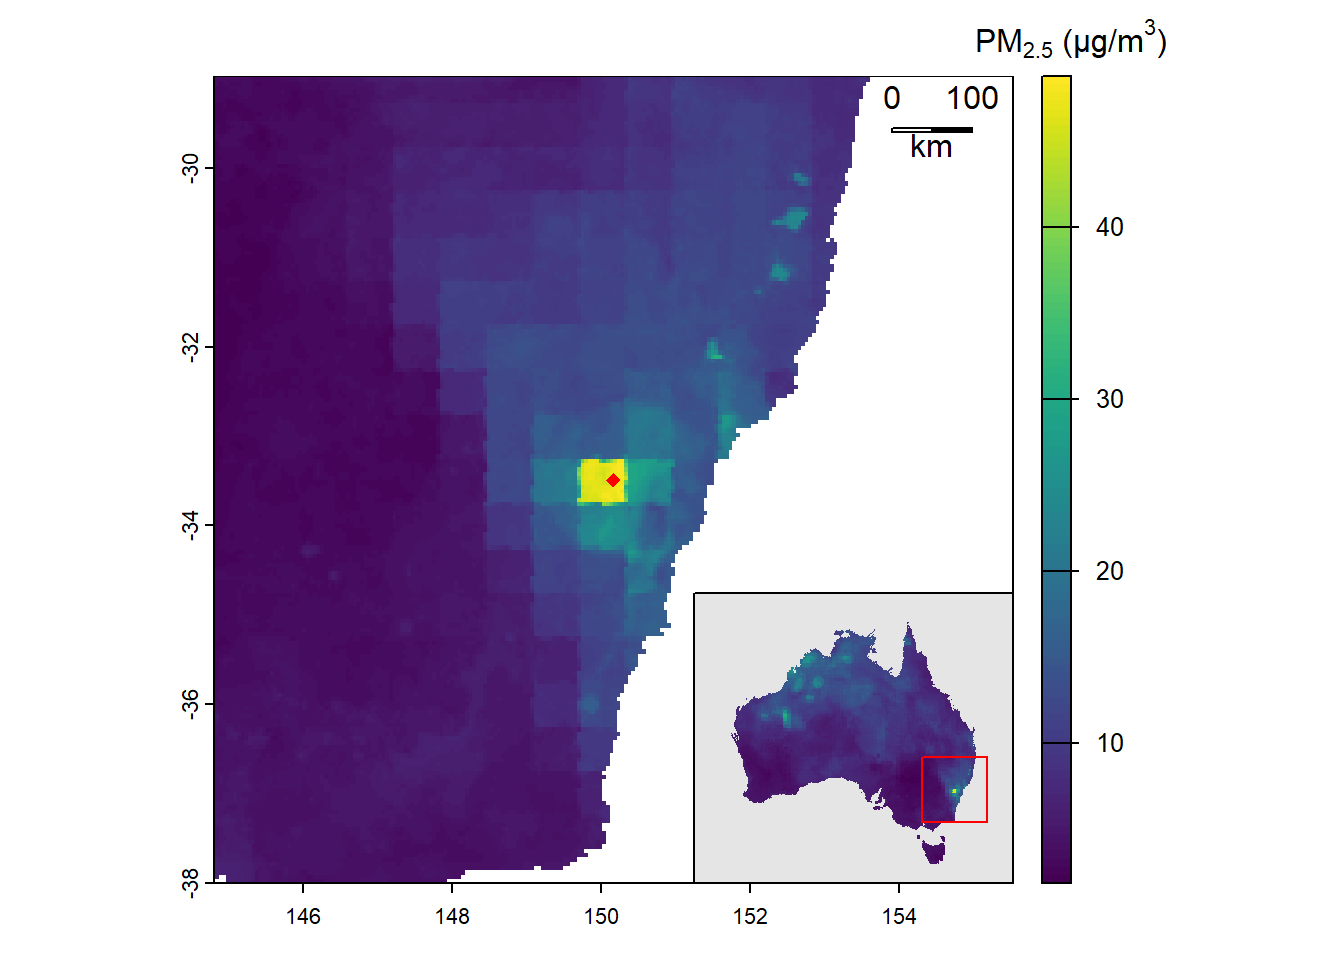
Figure 1.1: Raster map of total PM2.5 (µg/m3) for Australia on 2013-10-18. Lithgow (NSW) is marked with a red diamond, corresponding to the location of the STL decomposition shown below.
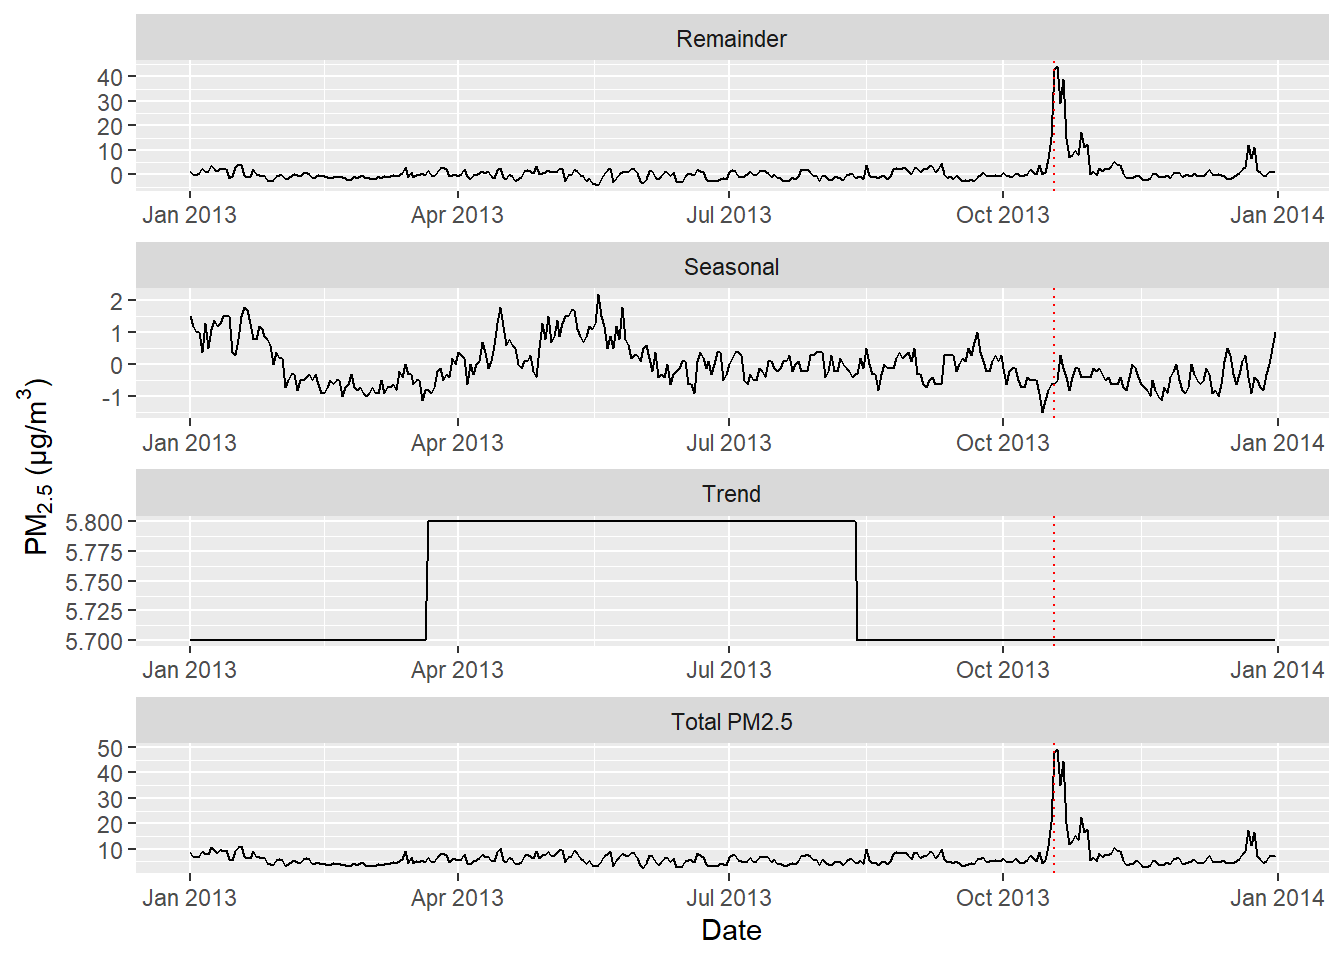
Figure 1.2: STL decomposition of total PM2.5 (µg/m3) into trend, seasonal and remainder components for the pixel at Lithgow (NSW). Dotted red line indicates the date 2013-10-18, corresponding to the above raster map. This location was affected by the nearby State Mine bushfire. (Note the scale for y axis is not fixed.)
Read more about the dataset and its development in the Metadata and Methodology.
The dataset is available on request for research purposes. It is managed by the Clean Air Research Data and Analysis Technology (CARDAT) team of the Centre for Safe Air (CSA). Please read the full data sharing policy and submit an access request through the CARDAT Data Access Form.
Acknowledgements
The development of the Total and Bushfire-specific PM2.5 2001-2020 V1.3 dataset was funded by the Australian Research Data Commons (ARDC), as part of the Bushfire Data Challenges - Assessing the impact of bushfire smoke on health project.
We acknowledge the Sydney Informatics Hub and the University of Sydney’s high performance computing cluster Artemis for providing the high performance computing resources on which the Total and Bushfire-specific PM2.5 V1.3 datasets were generated.
We would also like to thank Dana Jordan for her assistance during the QA/QC process.