9 Flags
The absolute PM2.5 and STL decomposition remainder (see STL decomposition) may be used to determine when PM2.5 concentrations are higher than is typical. However, this does not differentiate between sources, of which bushfires, dust and wood heater smoke are major contributors in Australia. The calculated flags may be used to aid in differentiating days of high PM2.5 due to bushfires and those due to other sources.
Some combination of the flags can provide an indication of whether that particular day’s PM2.5 is likely due to firesmoke. There is no definitive rule on which combination should be used. Rather, the choice should be guided by the study question and scope. The user should also consider using any additional data available in their study region to compare with or validate the predictions of bushfire-specific smoke.
9.1 Usage
Active fires
This flag indicates the presence of an active fire within a given distance of the pixel (10, 25, 50, 100 or 500km). Note the active fires are derived from satellite data and therefore may be less reliable under less ideal conditions such as cloud-covered days.
The presence of active fires in close proximity is not a definitive indication that PM2.5 is primarily due to fire smoke as the flag does not indicate intensity nor account for wind direction. It is possible for a pixel to have low bushfire-specific PM2.5 even with an active fire nearby if the wind direction directs smoke away from that location, or if the active fire is of low intensity.
Dust
The dust flags from both MERRA-2 and CAMS satellite-derived datasets indicate higher than usual (compared to the entire study region and period) concentrations of dust at that pixel using various thresholds (50th, 75th and 95th percentiles).
Temperature
Temperature flags are set to show days on which the mean daily temperature is below a certain threshold (12°C, 15°C and 18°C). This is a proxy for likely wood heater smoke as heater usage is more probable in colder weather. Wood heater usage is also dependent on other factors such as housing structure and density, climatic conditions and socioeconomic status.
Statistical thresholds
The statistical flags indicate an exceptional level of estimated PM2.5 concentration in comparison with the full timeseries for that particular pixel. It is important to note that these two flags differ in what is considered exceptional.
The statistical flag smoke_p95_v1_3 is the 95th percentile of estimated total PM2.5 at that pixel over the whole study period, and thus is a single absolute value PM2.5 threshold regardless of timepoint (Fig. 9.1 (a)).
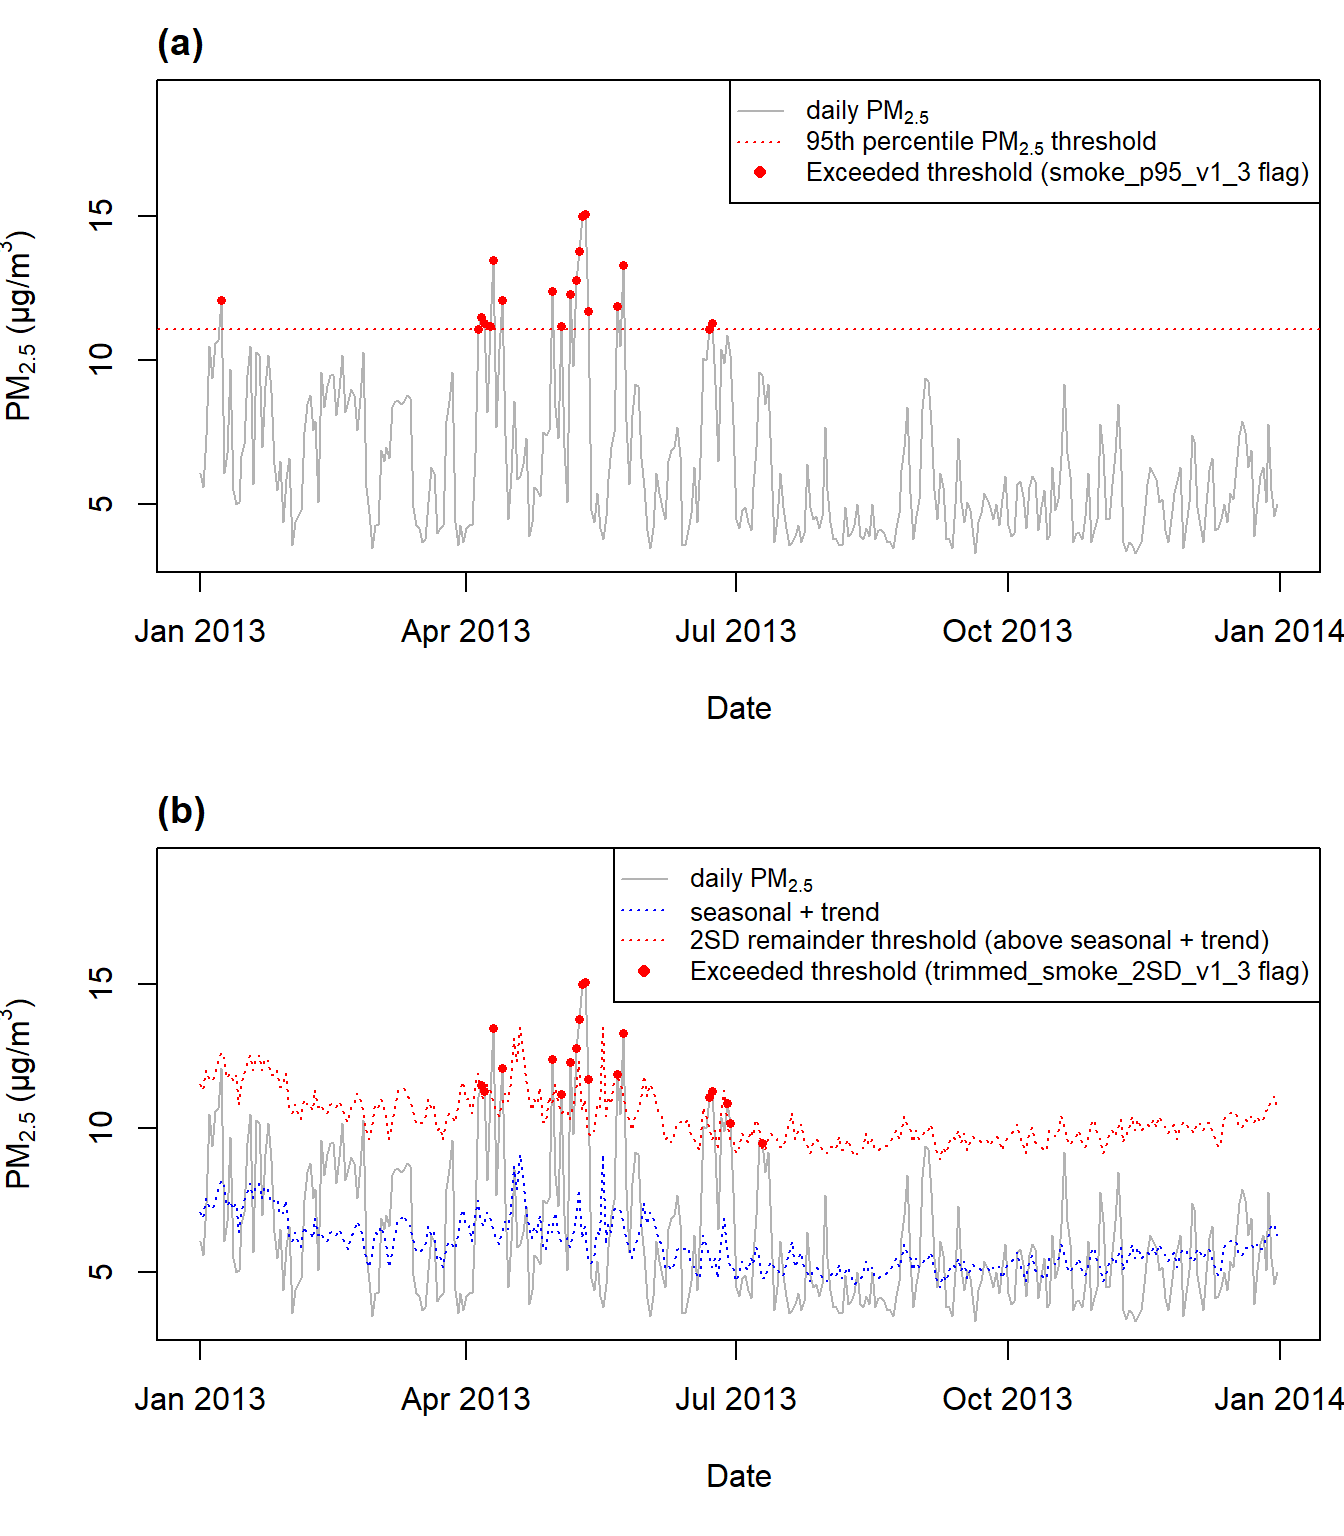
Figure 9.1: Comparison of statistical flags using thresholds of the 95th percentile of total PM2.5 (top) and 2 standard deviations of the remainder (bottom) for Melbourne (Victoria).
In contrast, the statistical flag trimmed_smoke_2SD_v1_3 indicates where the remainder has exceeded 2 standard deviations of the remainder at that location over the study period. Remembering that the STL components sum to the total PM2.5 (see Figure 8.1 and 8.3 in the previous section), the remainder in Figure 9.1 (b) is the difference between total PM2.5, and the seasonal and trend components combined (grey and blue lines, respectively). The threshold for trimmed_smoke_2SD_v1_3 (remainder > 2SD of the remainder) is therefore equivalent to the total PM2.5 being greater than the seasonal + trend + 2SD of the remainder.
This takes into account the seasonal fluctuations of that location and is intended to flag a pixel when the total PM2.5 is unusually high given the temporal patterns of that location.
For the example in Figure 9.1, slightly higher PM2.5 levels (seasonal + trend) are expected in the summer months whereas levels in colder months (June to September) remain low. Note one day in summer (January) is flagged by smoke_p95_v1_3 as it is unusually high compared to the long-term average. However, this day is not flagged by trimmed_smoke_2SD_v1_3 since the concentration is not high considering the levels typically experienced at this point in the year. The reverse situation can be observed in July. Multiple days are flagged by trimmed_smoke_2SD_v1_3 but not by smoke_p95_v1_3 as the PM2.5 concentration is lower than long-term average but higher than typical of winter days at this location.